

Greenhouse efficiency and output per employee: how to compare your nursery
Key Metrics for Benchmarking Your Nursery’s Labor Productivity
The most useful benchmark is output per full-time equivalent (FTE), measured in a unit that fits your crop, such as pots, trays, or plants shipped per year. Add labor cost per unit and you have the two numbers that show how efficiently your people turn time into product.
A few supporting metrics sharpen the picture. Track hours per 1,000 plants for the main handling steps (potting, moving, watering, packing). Record absenteeism and turnover as well, because physically heavy work shows up there first. Finally, separate your fixed team from seasonal and temporary labor, since peak-season dependence often hides the true cost per unit.
Consistency matters more than precision. Pick a clear definition for each metric, measure it the same way every month, and keep a simple log. Even a rough baseline gives you something solid to compare against later.
Where Your Numbers Stand Against Industry Peers
Comparing yourself to peers works best when you compare like with like: similar crops, similar scale, similar degree of mechanization. A 15-hectare pot plant nursery and a 150-hectare cut flower operation have very different labor profiles, so a raw number means little without context.
Useful sources include industry associations, accountancy benchmark reports, study groups with fellow growers, and conversations with suppliers who visit many nurseries. Research and industry experience both suggest that the biggest gaps between nurseries rarely come from crop knowledge. They come from how much of the day is spent on manual handling and internal transport.
When your output per FTE trails comparable nurseries, resist the urge to blame the team. Low output is usually a layout and process problem, not a motivation problem. That leads straight to the question of where the hours actually go.
Hidden Time Losses Behind a Low Output per Employee
The biggest hidden losses are walking, carrying, waiting, and handling the same product more than once. These tasks feel like part of the job, so they rarely appear in any plan, yet they can consume a large share of a working day.
Common time thieves in the greenhouse
- Manual internal transport: pushing trolleys, lifting trays, and carrying pots between stations.
- Waiting time: a potting team idle because supply is late, or a packing line stalled because the previous step is slow.
- Double handling: setting product down, picking it up again, and moving it twice for lack of a buffer.
- Physical strain: heavy lifting that drives sick leave and turnover, which then forces constant retraining.
A simple way to uncover these losses is to follow one batch of plants from start to finish with a stopwatch and a notebook. Note every moment where the product waits or a person walks without adding value. Most growers are surprised by how little of the route involves actual crop work.
How Internal Transport Automation Raises Output per FTE
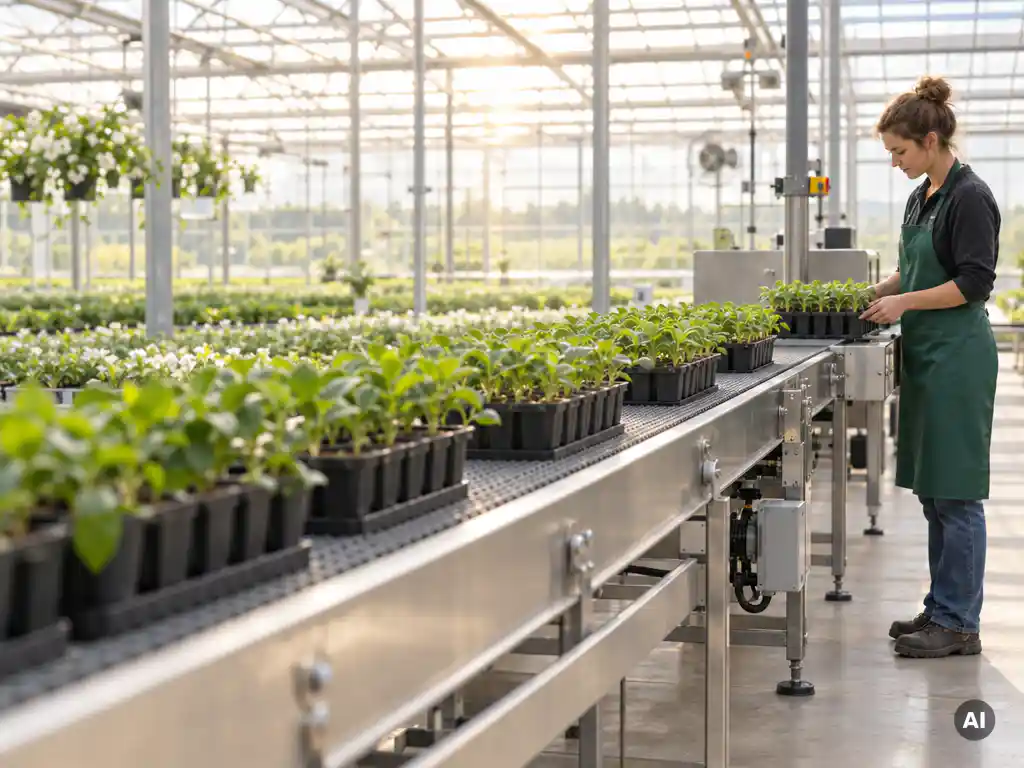
Automating internal transport raises output per FTE because machines take over the repetitive moving and buffering, while people focus on the tasks that need judgment and care. Conveyors, buffer tables, and roller tracks keep product flowing at a steady pace, so each person handles far more plants per hour with less physical effort.
The effect compounds across the line. When potting, watering, and packing connect through conveyor belts and buffers, bottlenecks disappear and idle time shrinks. Workstations can be fitted with work tables, scales, and lighting, which makes the work more ergonomic and the output more consistent.
The impact can be dramatic. Nurseries we work with have gone from 26 to 6 FTE for the same output after automating their internal transport. Results like this depend on the setup, of course, but they show how much capacity sits locked inside manual handling. Fewer staff are needed, the remaining team does more rewarding work, and the nursery becomes far less exposed to labor shortages.
A Step-by-Step Route to a Leaner Nursery
The most practical route is to start small, measure the result, and expand in stages. There is no need to rebuild the whole operation at once.
- Measure your baseline. Record output per FTE, labor cost per unit, and time spent on transport and handling.
- Find the biggest bottleneck. Pick the single step where people wait, walk, or lift the most.
- Test with a mobile solution. A flexible conveyor, ideally rented during a peak period, lets you experience the benefit before committing to a larger investment.
- Review the numbers. Compare hours per 1,000 plants and absenteeism before and after.
- Grow into fixed systems. Once the gain is proven, connect more steps into a fully integrated line.
We handle hardware, software, and installation ourselves, so there is one partner to coordinate rather than several. If you want to see what your own numbers could look like in 2026, get in touch with us for advice tailored to your crop and layout. A short conversation about your current process is often enough to spot the first quick win.
Greenhouse efficiency is built one measured improvement at a time. Start with the baseline, remove the biggest time thief, and let the results guide the next step.
Frequently Asked Questions
How do I calculate output per FTE if I rely on a lot of seasonal and temporary workers?
Convert all worked hours, including seasonal and temporary staff, into full-time equivalents by dividing total hours worked in the year by the hours of one full-time contract (for example, 1,720 hours). Then divide your total output (pots, trays, or plants shipped) by that FTE number. Calculate this figure separately for your fixed team and for peak periods so you can see how much seasonal dependence is inflating your true cost per unit.
How often should I review my labor productivity metrics?
Log your metrics monthly and review them every quarter, with an extra check after any change to your process or equipment. Monthly logging helps you spot seasonal patterns, while quarterly reviews are long enough to show real trends instead of normal fluctuations. Always compare against the same period in the previous year, as spring and autumn peaks behave very differently from quieter months.
How do I run a time study on one batch of plants without disrupting daily work?
Pick a normal production day and follow a single batch from the first handling step to dispatch, noting start and stop times for each step, including walking, waiting, and double handling. Do this with a notebook or a simple spreadsheet on a tablet, and tell the team beforehand that you are measuring the process, not judging individuals. Repeat the exercise on a second day to check that the first result was representative.
What if my nursery is too small or too varied in crops to justify automating internal transport?
Start with a mobile or modular solution, such as a flexible conveyor or buffer table, rather than a fixed installation. Renting one during your busiest weeks lets you measure the effect on hours per 1,000 plants without a large upfront investment. If the numbers show a clear gain, you can add further steps later, and flexible systems also cope better with changing crop mixes.
What are the most common mistakes when benchmarking labor productivity?
The most frequent mistakes are comparing against nurseries that are not truly similar, changing metric definitions from month to month, and ignoring indirect hours such as internal transport, cleaning, and retraining. Another common error is focusing only on labor cost per hour instead of output per hour, which can hide inefficient processes behind low wages. Define each metric clearly, write it down, and stick to it.
How can I get my team on board with changes to workflow or automation?
Involve employees early by asking them where they lose the most time or experience the most physical strain, since they often know the bottlenecks better than anyone. Explain that the goal is to remove heavy, repetitive tasks and shift people toward more skilled work, not simply to cut hours. A small pilot on one workstation lets the team see and shape the benefits before you roll anything out more widely.
Which results should I expect to see first after improving internal transport?
The earliest changes are usually shorter waiting times, fewer manual lifts, and a steadier flow between workstations, which show up as lower hours per 1,000 plants within weeks. Reduced absenteeism and lower turnover tend to follow over a few months as physical strain decreases. Compare these figures against your baseline so you can quantify the improvement and decide where to automate next.